Showing posts with label Harrit. Show all posts

Thursday, March 22, 2012

Comparison of Gray Layer XEDS by Harrit vs. Millette

Abstract

Harrit e.al. [1] and Millette [2] both examined the gray layers of red-gray chips found in the WTC dust using XEDS. This article will show that all nine gray layers are probably oxidized steel, with no significant differences in the level of oxidation between the two publications. However, while Harrit's four samples may well be the same steel alloy, Millette's seem to be different steel alloys. Perhaps one of Millette's specimens is of identical or similar steel as Harrit's.

Introduction

I measured the XEDS graphs of gray layer material thus far published by Harrit e.al. and Millete. Here are links to the bitmaps:

Harrit e.al.: Chips (a) – (d)

Millette: 9119X0135(3)_pt2, 9119-5230M3451B-crosssec2-gray(1), 9119-5230M3451B-crosssec1-gray(1), 9119-4808L1616(3)_pt2, 9119-4795L1560(1)_pt1

The following Table lists the peak height in pixels:

Element

C

O

Fe

Al

Mn

Fe

Fe

Level


K

L-a

K-a

K-a

K-a

K-b

Edge Energy (keV)


0.54

0.84

1.49

5.9

6.4

7.08

Millette's gray layers:


9119X0135(3)_pt2

5

23

10

4

0

88

13

9119-5230M3451B-crosssec2-gray(1)

7

201

64

0

0

215

29

9119-5230M3451B-crosssec1-gray(1)

7

215

74

0

0

164

22

9119-4808L1616(3)_pt2

7

41

11

0

0

97

15

9119-4795L1560(1)_pt1

13

56

18

10

0

88

13

Harrit's gray layers:


Chip (a)

20

266

98

0

10

322

45

Chip (b)

32

335

127

0

9

326

48

Chip (c)

30

320

144

0

0

215

32

Chip (d)

33

324

140

0

11

309

43


I then computed the relative peak heights, using a formula (Individual peak height) / Sum(all peaks in the same line). So for example, in Sample Chip (a), C has a pixel height of 20px, and the sum off all pixel heights is (20+266+98+0+10+322+45), and thus relative peak height of C would be 20 / (20+266+98+0+10+322+45) = 2.63%. With this crude method, I normalize the different absolute dimensions of the graphs. Here's the result:


Element

C

O

Fe

Al

Mn

Fe

Fe

Level


K

L-a

K-a

K-a

K-a

K-b

Edge Energy (keV)


0.54

0.84

1.49

5.9

6.4

7.08

Millette's gray layers: (This line: Arithmetic mean)

3.39%

30.38%

10.05%

1.57%

0.00%

47.68%

6.92%

9119X0135(3)_pt2

3.50%

16.08%

6.99%

2.80%

0.00%

61.54%

9.09%

9119-5230M3451B-crosssec2-gray(1)

1.36%

38.95%

12.40%

0.00%

0.00%

41.67%

5.62%

9119-5230M3451B-crosssec1-gray(1)

1.45%

44.61%

15.35%

0.00%

0.00%

34.02%

4.56%

9119-4808L1616(3)_pt2

4.09%

23.98%

6.43%

0.00%

0.00%

56.73%

8.77%

9119-4795L1560(1)_pt1

6.57%

28.28%

9.09%

5.05%

0.00%

44.44%

6.57%

Harrit's gray layers: (This line: Arithmetic mean)

3.54%

38.50%

15.77%

0.00%

0.90%

36.11%

5.18%

Chip (a)

2.63%

34.95%

12.88%

0.00%

1.31%

42.31%

5.91%

Chip (b)

3.65%

38.20%

14.48%

0.00%

1.03%

37.17%

5.47%

Chip (c)

4.05%

43.18%

19.43%

0.00%

0.00%

29.01%

4.32%

Chip (d)

3.84%

37.67%

16.28%

0.00%

1.28%

35.93%

5.00%

Discussion

I notice that Millette's graphs tend to have relatively larger peaks on the high side of the energy spectrum than Harrit's: On average, the ratio between the K-alpha and L-alpha level of Fe in Millette's graphs is 47.68% / 10.05% = 4.74. In Harrit's samples, that ratio is 36.11% / 15.77% = 2.29 – less than half. Of course, both K-alpha and L-alpha represent the same amount of Fe per sample – the differences in relative peak height thus do not represent differences in relative element abundance. So in order to compare the Fe:O ratio, it would be wrong to compare O with the far-away Fe-K-alpha level. I think it is a better idea to compare O with the nearby L-alpha level of iron. These ratios are:


Sample

Ratio Fe(L-a) : O(K-a)

Millette's gray layers:

0.337

9119X0135(3)_pt2

0.435

9119-5230M3451B-crosssec2-gray(1)

0.318

9119-5230M3451B-crosssec1-gray(1)

0.344

9119-4808L1616(3)_pt2

0.268

9119-4795L1560(1)_pt1

0.321

Harrit's gray layers:

0.407

Chip (a)

0.368

Chip (b)

0.379

Chip (c)

0.450

Chip (d)

0.432


Here is a plot of the individual samples in both datasets, ordered from highest to lowest Fe:O ration within each set:

While the Fe:O ratio appears slightly lower in Millette's samples, the difference isn't major (on average, Harrit e.al. and Millette differ from each other by ~20%). In any case, Millette's gray layers would appear slightly more oxidized (higher Fe:O-ratio means lower O:Fe-ratio), assuming the relative heights of neighboring peaks can be compared across the studies. I conclude that the data provided by both Harrit e.al and Millette indicate the presence of iron that is oxidized to a comparable degree.

All samples also show some carbon. In Harrit's samples, the ratios C : Fe(L-alpha) are all within a narrow band from 0.204 to 0.252 (mean: 0.225), while Millette's scatter from 0.095 to 0.722 (mean: 0.413). I caution the reader that XEDS signals for C are very sensitive to many influences, and variation in the data doesn't necessarily reflect an equal degree of variation in abundance.

On the other hand, 2 of Millette's 5 samples show some Al, and none Mn, while 3 of Harrit's 4 samples show some Mn, but no Al.

Conclusions

It would appear that all 9 samples are consistent with oxidized carbon steel; but while Harrit may well have 4 samples from the same steel, it appears that Millette's specimens may be different steel alloys. I find it possible that the 9119-5230M3451B specimen may be the same, or a similar, steel that Harrit e.al. looked at, while the 9119X0135(3), 9119-4808L1616(3) and 9119-4795L1560(1) specimens are different steels on account of their Al-content and probably too high carbon content.

This finding

  • lends confidence to the belief that both Harrit an Millette looked at red-gray chips where the gray layer is oxidized structural steel and red the layer is mineral pigments in organic matrix

  • reinforces the suspicion that there are several different kinds of red-gray chips in WTC dust

  • highlights the need to carefully identify and distinguish these different kinds of red-gray chips before any particular conclusions or further study are contemplated.

References

[1] Niels H. Harrit, Jeffrey Farrer, Steven E. Jones, Kevin R. Ryan, Frank M. Legge, Daniel Farnsworth, Gregg Roberts, James R. Gourley and Bradley R. Larsen: Active Thermitic Material Discovered in Dust from the 9/11 World Trade Center Catastrophe. The Open Chemical Physics Journal, 2009, 2, 7-31. Figure 6.

[2] James R. Millette: Report of Results: MVA9119. Progress Report on the Analysis of Red/Gray Chips in WTC dust. Prepared for Classical Guide, Denver, 29 February 2012. Appendix D: SEM Analysis of Cross-Sections (20 kV)

Friday, March 16, 2012

Another primer at the WTC: LaClede Standard Primer

Abstract

There was not only one steel primer used on WTC tower structural steels, but at least one other primer:

LaClede Standard Primer is a zinc-free paint formulation with which the floor joists of the twin towers were painted.

The painted area of these LaClede-painted floor joists in both towers was roughly 600,000 m2 while Tnemec is only known to have been specified for about 400,000 m2 of perimeter column surface. For the rest of the structural steel – core columns, hat truss and others, a total of 300,000 m2 the primer used isn't known.

Claims that Niels Harrit proved that some red-gray chips in the WTC dust are not WTC primer are basing this claim on the FALSE assumption that Tnemec was the only primer used. In fact, I will show that the chips that Harrit proved to not be Tnemec look very much like LaClede Standard Primer.

Introduction

Back in May 2009, Niels Harrit wrote “Why The Red/Gray Chips Are Not Primer Paint” [1]. In it, he shows the composition of Tnemec Red, which has, among others, Zinc Yellow as it's main pigment. He then shows, in his Fig. 5, the XEDS spectra of the red layers of four red-gray chips labeled (a)-(d) from WTC dust, which he and 8 others had characterized in a paper published in April 2009 [2]. Result: Since Chips (a)-(d) contain no Zn, they can't be Tnemec. I agree with this finding – these four chips indeed are not Tnemec.

But Tnemec wasn't the only steel primer used in the WTC! As far as is known, Tnemec was the specified primer for the WTC perimeter columns[3].

At least one other primer has been applied to WTC steel: LaClede Steel Company, manufacturer of the floor trusses [4], used their own shop primer, or LaClede Standard Primer with the following composition [5]:

  • Pigment: 28.5% by weight

  • Iron Oxide: 55%

  • Aluminium Silicate: 41%

  • Strontium Chromate: 4%

  • Vehicle: 71.5%

  • Epoxy Amine and other: 100%

I find this false claim, that there was only one primer (Tnemec) used in the WTC towers, quite often in recent articles by people who want to defend Harrit e.al.'s claim that the red-gray chips are somehow nano-thermitic, for example at AE911T [6a]. These authors need to understand that they err: They have so far overlooked LaClede Standard Primer!

LaClede Standard Primer

The above formulation of LaClede Standard Primer can be broken into chemical elements, with a few reasonable assumptions:

  • “Iron oxide” is hematite, chemical formula Fe2O3, a red pigment. Hematite pigments are bright red at particle sizes between 100 and 300 nanometers, and in that size it is universally used in all kinds of paints.

  • “Aluminium Silicate” is kaolin, chemical formula Al2Si2O5(OH)4, a clay mineral very commonly used in paints to control gloss consistence. Kaolin appears naturally in platetelets some micrometers across and some tens of nanometers thick, which tend to stack.

  • The cured epoxy vehicle is polymeric and it is difficult to give a sum chemical sum formula, but it is dominated by carbon (C, 68% by weight), oxygen (O, 13%), hydrogen (H, 9%) and nitrogen (9%)

With these chemical formulas, I computed the elemental composition of LaClede Standard Primer:

  • C: 48% by weight

  • O: 21%

  • Fe: 11%

  • H, N: 7% each

  • Si: 2.5%

  • Al: 2.4%

  • Sr: 0.5%

  • Cr: 0.3%

Using DTSA-II, a free multiplatform software package for quantitative x-ray microanalysis [7], I simulated a bulk sphere with the above chemical composition, using the same 20 keV that Harrit e.al. used:

The five larges peaks are, from left to right: C, O, Al, Si and Fe. Note the relative height: C is nearly twice as high as O; O is higher than than Al and Si; Al and Si are nearly equal; Fe is perhaps 70% of Si. Note that there is a small bump for Cr (chromium) at 5.4 (keV) on the x-axis, but none for Sr (strontium). The reason why strontium is invisible is that its main peak would be nearly exactly where the Si peak is, so it is hidden under the much larger Si signal.

We have estimated that the total painted surface area of the LaClede floor joists was about 600,000 m2 in both towers combined, or 50% more than the surface area of the exterior columns that were painted with Tnemec.

Discussion

Compare the XEDS graph of LaClede primer with Harrit's chips (a)-(d):


Now notice: C is again the highest peak by far, O is second in three of the four chips. Al and Si are nearly the same, Fe is typically about 70% of Si. And there is a small bump at 5.4 keV in chips b and d, which is chromium!

In [1], Harrit presents a more detailed XEDS graph for chip (a):

Do you see how Harrit has detected Cr (chromium) and even Sr (strontium) in trace amounts? Yep, there are also signals for S and Ca. Perhaps a tiny inclusion of gypsum, but I wouldn't bet on that.

Conclusion

I have shown that Harrit's argument, re-gray chips (a)-(d) can't be primer because they are not consistent with Tnemec, falls flat on its face, because Tnemec was not the only primer used on WTC steel. Another primer that must be considered is LaClede Standard Primer, and there could be even other primers of which no documentation seems to exist (we don't know for example which primer, or primers, was painted on the core columns and beams).

I have further shown that the XEDS spectra of chips (a)-(d) are very much consistent with the the paint formulation of LaClede Standard Primer.

I call on all honest and science-minded people in the 9/11 Truth Movement to reject Harrit's claim that chips (a)-(d) can't be primer as premature and consider LaClede Standard primer as a possible source for some of the red-gray chips. Tnemec may be another such source of other chips; in fact it seems that the MEK-soaked chip in [2] is consistent with Tnemec, as I have shown in another post [8] – this MEK chip can't possibly be identical with chips (a)-(d)! [9].

I further call on all students of [2] to realize that Harrit e.al. have analysed several different kinds of red-gray chips, and not pretend they are all basically the same.

References

[1] Niels H. Harrit: Why The Red/Gray Chips Are Not Primer Paint. Open Letter, May 2009

[2] Niels H. Harrit, Jeffrey Farrer, Steven E. Jones, Kevin R. Ryan, Frank M. Legge, Daniel Farnsworth, Gregg Roberts, James R. Gourley and Bradley R. Larsen: Active Thermitic Material Discovered in Dust from the 9/11 World Trade Center Catastrophe. The Open Chemical Physics Journal, 2009, 2, 7-31

[3] Carino, N. J.; Starnes, M. A.; Gross, J. L.; Yang, J. C.; Kukuck, S. R.; Prasad, K. R.; Bukowski, R. W.: Passive Fire Protection. Federal Building and Fire Safety Investigation of the World Trade Center Disaster (NIST NCSTAR 1-6A). 2005. Page 87: “...Series 10 Tnemec Prime (99 red), which is the primer that was specified for the exterior columns”

[4] Luecke, W. E.; Siewert, T. A.; Gayle, F. W.: Contemporaneous Structural Steel Specifications. Federal Building and Fire Safety Investigation of the World Trade Center Disaster (NIST NCSTAR 1-3A). 2005. Table 3-5, p. 21

[5] Gross, J. L.; Hervey, F.; Izydorek, M.; Mammoser, J.; Treadway, J.; Fire Resistance Tests of the Floor Truss Systems. Federal Building and Fire Safety Investigation of the World Trade Center Disaster (NCSTAR 1-6B). 2005. Appendix B, p. 157 of the PDF

[6a] AE911Truth Staff: FAQ #7: Aren’t the Red-Gray Chips Identified in the WTC Dust Merely Primer Paint from the WTC Steel Structural Elements?. Architects & Engineers for 9/11 Truth, 2012/03/15. Retrieved 2012/03/16

[7] Chuck Fiori, Carol Swyt-Thomas, and Bob Myklebust: DTSA-II Desktop Spectrum Analyser. Retrieved 2012/03/15

[8] Oystein: Steven Jones proves primer paint, not thermite. 2011/03/31

[9] Oystein: Why red-gray chips aren't all the same. 2012/03/14

Wednesday, March 14, 2012

Why red-gray chips aren't all the same

Abstract

Ever since Harrit e.al.'s paper "Active Thermitic Material discovered" (ATM, [1]) was published in April 2009, the world of 9/11 debaters (a small world, by the way) was split into two camps:

  • 9/11 Truthers who believe all the chips are super-secret high-tech military-grade beast of extremely energetic nano-thermite. Note the stress on „all the chips“

  • Skeptics who see that the chips are not all the same, are not thermitic, but very probably different kinds of paint instead.

In this post I will show that one particular chip in ATM, the one they soaked in MEK and present in Fig. 12-18, cannot possibly the same kind of material as the four chips they present in Fig. 2-11. Assuming that both represent the same material is preposterous. The most benign explanation for why the authors make that assumption is wishful thinking. We can rule out simple error or that they overlooked something, because it has been pointed out to them more than once in the past that the chips are different. A less benign, but perhaps more probable explanation would be outright fraud.

Visual comparison

Here are the chips I am talking about – first, the four chips they first present. I usually refer to them as chips (a)-(d):

Photobucket

As you can see, the red layers all look pretty much like they could be the same stuff, perhaps paint. Color is very similar, finish is very similar. Same goes for the gray layer, which could be metallic for all we know (and yes, Harrit e.al. figure out correctly that the gray layer is a bulk of oxidized iron). Notice that we can see and roughly measure the thickness of the red layer in the inset of Fig 2(d): It is roundabout 15µm thick.

Next up, the MEK-chip:

Photobucket

Whoa – what's up there?? The photo is totally out of focus! So yeah it is generally some kind of red and there seems to be some gray on the right, but does it have the same finish as (a)-(d)? Frankly, I can't tell! How thick is the layer? We can't tell from the photo, but Harrit e.al. included another image. In the following, the chip is shown after they had soaked it in a solvent called MEK for 55 hours.

Photobucket

They explain on page 17:

The red layer of the chip was found, by visual inspection, to have swelled out from the gray layer by a factor of roughly 5 times its original thickness.

In Fig 12(b), the red layer, on the left, is between 250 and 300 µm thick, aproximately, so before soaking it was 50-60 µm. Quite a bit more than the 15 µm of the red layer of chip (d) above, eh? (In Fig. 5, it is possible to roughly measure the thickness of the red layers of chips (a) and (b): approx. 32 and 13 µm respectively). So does that MEK chip look the same as the others? Hmmmm maybe, maybe not. Maybe not.

Harrit e.al. show high-magnification BSE (a form of electron microscopy) images for chips (a)-(d) in Fig. 4, Fig. 5 and Fig 8, where you can see the grains (identified by Harrit as hematite) and platelets (almost certainly kaolin, a natural clay) in the organic matrix. Unfortunately, no such BSE images exist for the MEK-chip, so we can't compare it to chips (a)-(d). The only other data we have is XEDS.

XEDS spectra

An introduction to XEDS (SEM-EDS)

(You may skip this section if you are not interested in technical details of this method)

XEDS (X-ray energy dispersive spectroscopy, also abbreviated SEM-EDX, see Wikipedia [2]) is

...an analytical technique used for the elemental analysis or chemical characterization of a sample. […] a high-energy beam of charged particles such as electrons or protons (see PIXE), or a beam of X-rays, is focused into the sample being studied. […] The number and energy of the X-rays emitted from a specimen can be measured by an energy-dispersive spectrometer. As the energy of the X-rays are characteristic of the difference in energy between the two shells, and of the atomic structure of the element from which they were emitted, this allows the elemental composition of the specimen to be measured.

In an XEDS graph, the location of a peak along the x-axis identifies a chemical element, while the height of the peak along the y-axis is indicative of the relative abundance of the element in the sample. Please note first that equal peak heights of two different elements do not automatically mean same abundance, although this is roughly true for many elements (for example, it is true for aluminium and silicone), but not all (for example, if strontium and chromium were equally abundant by mass, then the first peak of strontium at 1.81 keV would be only about 75% the height of the chromium peak at 5.41 keV. This is also dependent on factors like “accelerating voltage and/or contaminating surface films” [3]). A second note: The lightest elements, from hydrogen (1H) typically to beryllium (4Be) don't show up at all in an XEDS graph (depending on the device, not even up to carbon or nitrogen). The next lighter elements up to chlorine (17Cl) only have one peak associated to them. Starting with potassium (18K), more than one peak may show up, but in most cases, only one or two are dominant. Last note: Peak height scales with abundance. So if you double the abundance of, say, silicone in your sample, the Si-peak will be twice as high (roughly). If you want to look up only which elements have peaks at which energy levels (measured in keV – kilo Electronvolts), you may refer to [4]. Just klick on the element symbol you are interested in, and look in the column “Edge Energies”. Usually, the K-alpha level is your first major peak, K and K-beta for secondary peaks. Elements heavier than arsenic (33As) don't have important K-levels below 10 keV and are more usually identified by L-alpha or L-beta.

The spectra of Harrit e.al.

Harrit e.al. provide XEDS spectra for chips (a)-(d) in Fig. 7, and a spectrum for the MEK-chip (before soaking) in Fig 14. Let us first take a close look at all the peaks in Fig. 7 (shown below) and see if these four graphs are similar enough so we can be confident that all four show the same material. All have major peaks for 5 chemical element (from left to right, the major peaks: Carbon (C), oxygen (O), aluminium (Al), silicone (Si), iron (Fe)). In figure 7(c), Harrit e.al. have also labelled small peaks of natrium (Na), sulfur (S), potassium (K) and calcium (Ca). In addition, we think there are tiny but discernable signals for S and Ca in (a) and (b) as well, for chromium (Cr, K-alpha = 5.41 keV) in (a), (b) and (d), and titanium (Ti, K-alpha = 4.51 keV) in (d). While the small peaks could always be some sort of contamination (either on the surface, or of the minerals contained in the chips; for example, kaolin usually has small inclusions of Ti and Ca), the major elements do show up in comparable relative peak heights:

  1. In all four chips, C is by far the highest peak, being several times (2.85x to 7.45 time, average 4.3 times) as high as the second highest, peak, O

  2. O is the second highest in 3 graphs, and barely beaten by Si in 1. O has between 85% and 300% the peak hight of Si (average: 161%)

  3. Si and Al follow in third and fourth place, at almost the same hight. Al has between 87% and 110% the peak hight of Si (average: 96%). This result is consistent with both elements appearing in equal molar amounts.

  4. Fe (K-alpha) is always the fifth-highest peak, reaching between 51% and 81% of Si (average 70.5%)

  5. Note that none contain zinc (Zn) or magnesium (Mg), and all have at most traces of Ca and S

Here is Fig. 7:

Now compare this to the MEK-chip, Fig 14:

Photobucket

It is very obvious that none of the characteristica of Fig. 7 are found here: For starters, Al is not among the 5 or 6 highest peaks, it is only number 7. Instead, Ca clocks in as the sceond highest peak. So let's go through the list item by item:

  1. C is not the highest peak, it is only the 3rd-highest. Instead of being at least 2.8 times as high as O, it has only about 60% of the height of O.

  2. O is much too abundant – relative to C (and, coincideltally, to Al) by a factor of at least 4.7

  3. Si and Al are not about equally abundant. Si-peak is too high relative to Al by a factor of 1.8

  4. There is way too much Fe relative to both Al and Si: Fe should be near 68% of Al, but it is actually 2.75 times as high. This means, too abundant by a factor of 4.

  5. The Ca peak is HUGE, it should only be a trace. The S-peak is BIG, it should at most be a trace. There should be no Zn at all. There is a peak between Zn and Al that Harrit e.al. did not label, but which certainly represents Mg. There should be no signal for Mg.

Discussion

How do Harrit e.al. explain these differences between Fig 7 and Fig 14? Here's how (page 17):

The resulting spectrum, shown in Fig. (14), produced the expected peaks for Fe, Si, Al, O, and C. Other peaks included calcium, sulfur, zinc, chromium and potassium. The occurrence of these elements could be attributed to surface contamination due to the fact that the analysis was performed on the as-collected surface of the red layer. The large Ca and S peaks may be due to contamination with gypsum from the pulverized wallboard material in the buildings.

So pretty much all of the Ca, all of the S, 75% of the Fe, 80% of the O, 45% of the Si, all of the Zn, all of the Mg is contamination? Gypsum, eh?

Here are three XEDS graphs for gypsum from the WTC [5]: Gypsum-01, Gypsum-02, Gypsum-03

Note that in the first two of the graphs, S peak is higher (by about 35% and 32%) than Ca, and in the third, which also has (calcium-?) carbonate, S is 33% lower than Ca. McCrone ([3] page 638) has S about 9% lower. This is to be expected, as the chemical formula for gypsum is CaSO4·2H2O - notice how Ca and S both have one atom in that molecule, their molar abundance is equal, their atomic weight is not much different (S: 32; Ca: 40; that's a ratio of 1:1.25). So, if you assume that gypsum is a major contaminant in Fig. 14, you must take off as much (+/- 33%) S as Ca – until you run out of S. Now, in Fig 14, Ca is 3 times as high as S. If you claim all of the S is from gypsum, and you remove all of it, and If I grant you that you may remove 33% more Ca than S, then the Ca peak is still almost as high as Fe, and higher than Si and Al. And the Fe-peak is still too high relative to C and Al, Si is too high relative to Al. So obviously, even if gypsum explaines all of the “contamination” with S, it would still constitute only a minor part of all of the “contamination”. In fact, to make Fig. 14 look similar to Fig. 7, you must

  • remove 80% of the oxygen (highest peak)

  • remove 95% of the calcium (2nd highest peak)

  • remove 75% of the iron(4th highest peak)

  • remove 45% of the silicone (5th-highest peak)

  • remove 95% of the sulfur (6th-highest peak)

  • remove all of the Zn

  • remove all of the Mg

  • remove most of the Cr

In other words: On average you must declare two thirds (65%) of the six most abundant elements to be contamination.

This is absurd. Preposterous. Wishful thinking. If not fraudulent.

Conclusion

A much better explanation is in order: Since no data exists, other than the base color and magnetic attraction, that shows that the MEK-chip is the same material as chips (a)-(d), since the visual appearance is doubtful, since the layer is too thick, and since the XEDS data shows that at least 65% of the mass of this chip is different from chips (a)-(d), the best and obvious conclusion is:

The MEK-chip is of a different material than chips (a)-(d). The assumption that the differences can be explained as contamination does not survice scrutiny and must be firmly rejected.

References

[1] Niels H. Harrit, Jeffrey Farrer, Steven E. Jones, Kevin R. Ryan, Frank M. Legge, Daniel Farnsworth, Gregg Roberts, James R. Gourley and Bradley R. Larsen: Active Thermitic Material Discovered in Dust from the 9/11 World Trade Center Catastrophe. The Open Chemical Physics Journal, 2009, 2, 7-31

[2] Energy-dispersive X-ray spectroscopy. Wikipedia, retrieved 2012/03/14

[3] Walter C. McCrone and John Gustav Delly: The Particle Atlas Edition Two, Volume III: The Electron Microscopy Atlas. Ann Arbor Science Publishers Inc., 1973, page 579

[4] Illinois Institute of Technology: Peridiodic Table. Last retrieved 2012/03/14

[5] US Geological Service: Particle Atlas of World Trade Center Dust. Open-File Report 2005–1165: On-line Report, öast retrieved 2012/03/14

Thursday, March 31, 2011

Some links on the Harrit paper

About the peer-review by David L. Griscom:
http://www.911-archiv.net/blog/sittingbull/exklusiv-referee-der-harrit-studie-outet-sich-es-ist-ein-weltweit-angesehender-material-physik-professor.html

Steven Jones presents data that inadvertantly proves sample e (the MEK-soaked chip) is WTC steel primer:
http://forums.randi.org/showthread.php?p=6959549#post6959549

2nd Editor in Chief resigned over the Harrit et al. nanothermite paper:
http://activistteacher.blogspot.com/2010/11/editor-in-chief-resigned-over-harrit-et.html
http://forums.randi.org/showthread.php?t=194752
http://screwloosechange.blogspot.com/2010/12/bentham-comedy-continues.html

Opinion: 911 Movement Needs Clean Up and Focus on Activism
http://activistteacher.blogspot.com/2010/11/911-movement-needs-clean-up-and-focus.html

Review of Harrit:
http://climateguy.blogspot.com/2010/11/peer-review-of-harrit-et-al-on-911-cant.html

Gunnar Ries debunks Harrit (critique of methods)
http://www.wissenslogs.de/wblogs/blog/mente-et-malleo/skeptische-ecke/2010-01-29/befand-sich-nanothermit-zwischen-den-tr-mmern-des-world-trade-centers
http://amphibol.blogspot.com/2010/02/wie-sich-verschworer-selbst.html
Harrit replies: http://mysteries-magazin.com/index.php?op=news&func=news&id=5252

Somebody at "Debunking the Debunkers" tries to debunk a post by me at JREF:
http://911debunkers.blogspot.com/2011/04/listening-to-debunker-arguments-is-like.html

The Tillotson paper on sol-gel nanothermite that is referenced in figure 29: http://www.doeal.gov/FOIADOCS/DOC00329.pdf

Added 2011/09/05:

About Harrit lecture in Lillehammer, Norway, on 2009/05/23 on Youtube

Transcript of what Norwegian Scientists said in that Youtube: http://www.911oz.com/vbulletin/archive/index.php?t-7562.html Another version, more from the source: http://web.archive.org/web/20110511192750/http://zelikow.wordpress.com/2009/05/22/norwegian-state-radio-initiates-public-debate-on-911-truth/

Mark Basile Video presentation "911 Dust Analysis Raises Questions": http://www.youtube.com/watch?v=AJ7hXrmMRPc#!

A good, practical article about the chemistry of thermite (many variants): http://www.amazingrust.com/Experiments/how_to/Thermite.html

Technical Data Sheets for commercial iron oxide pigments, giving pigment shape and size: Yipin Iron Oxide Pigments

Monday, September 13, 2010

Discussion of the Harrit ed.al. paper

Active Thermitic Material Discovered in Dust from the 9/11 World Trade Center Catastrophe

by Niels H. Harrit, Jeffrey Farrer, Steven E. Jones, Kevin R. Ryan, Frank M. Legge,
Daniel Farnsworth, Gregg Roberts, James R. Gourley and Bradley R. Larsen
The Open Chemical Physics Journal, Volume 2, pp. 7-31; 2009

Discussed at
JREF 1
Particularly Post 292 (Red layer is Paint with Kaolin pigments), Post 299 (grey layer is Micaceous Iron Oxide, used in anti-corrosion primer)
http://11-settembre.blogspot.com/2009/04/active-thermitic-material-claimed-in.html
A French paper by Jérôme Quirant (Moorea34)
Some physical and chemical properties of thermite and thermate are discussed here.

Note on page numbers: Each page of the PFD document has two page numbers: One written on top of the page, and the page number count of the PFD file. I will refer to pages by dual numbers as, for example "16(22)", meaning "page 16 of the PFD file (page 22 as written on top of page)".

Abstract

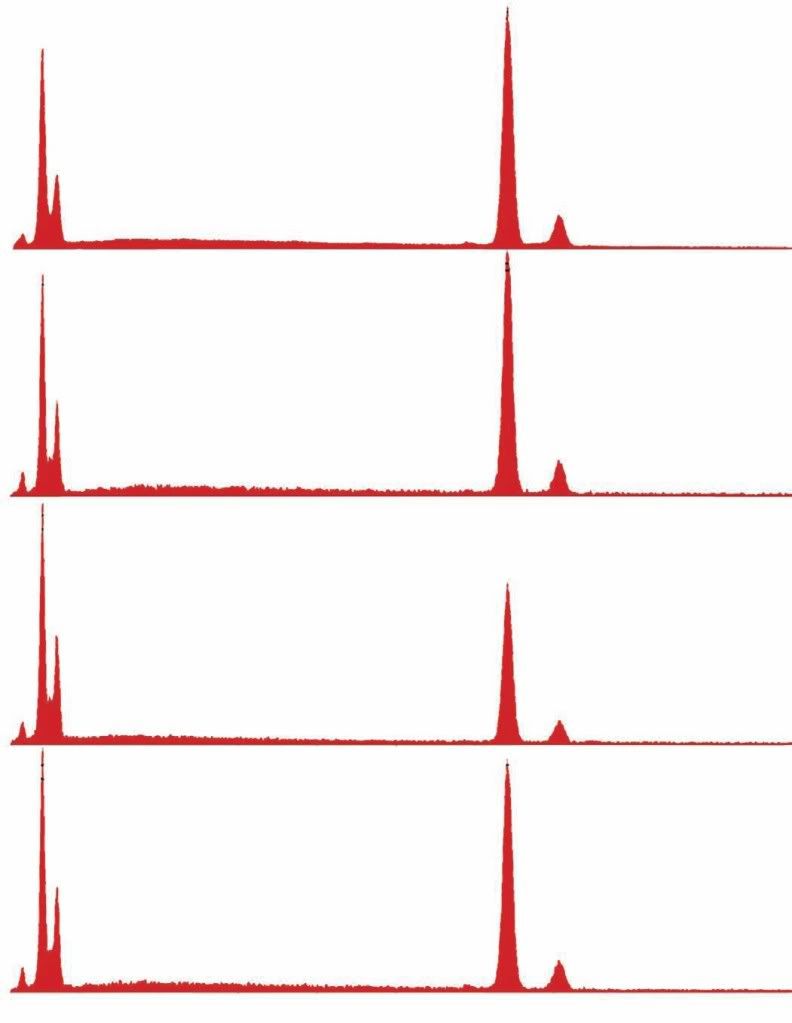
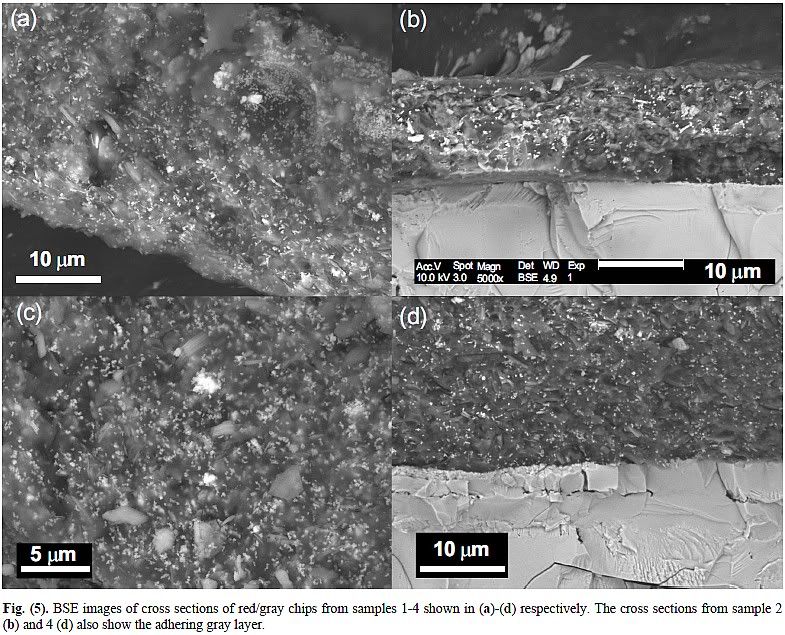
We have discovered distinctive red/gray chips in all the samples we have studied of the dust produced by the destruction of the World Trade Center. Examination of four of these samples, collected from separate sites, is reported in this paper. These red/gray chips show marked similarities in all four samples. One sample was collected by a Manhattan resident about ten minutes after the collapse of the second WTC Tower, two the next day, and a fourth about a week later. The properties of these chips were analyzed using optical microscopy, 
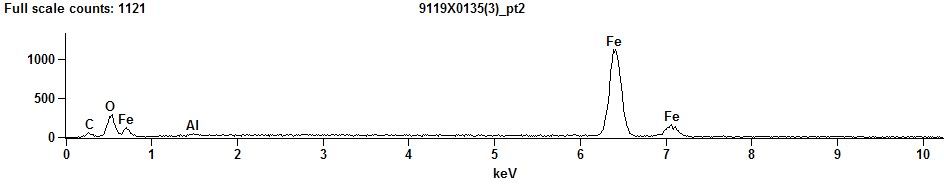
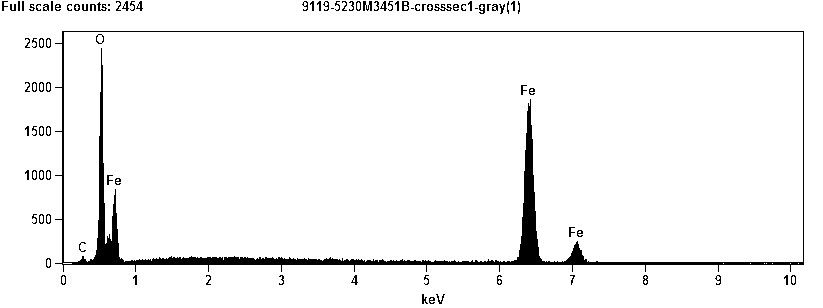
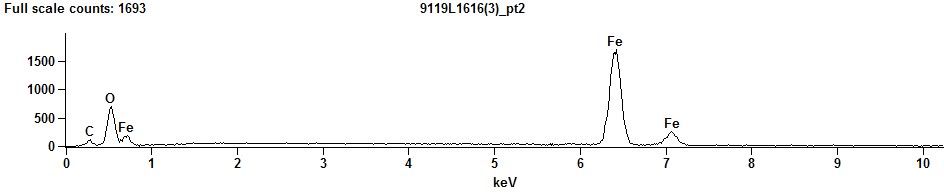
scanning electron microscopy (SEM), X-ray energy dispersive spectroscopy (XEDS), and differential scanning calorimetry (DSC). The red material contains grains approximately 100 nm across which are largely iron oxide, while aluminum is contained in tiny plate-like structures. Separation of components using methyl ethyl ketone demonstrated that elemental aluminum is present. The iron oxide and aluminum are intimately mixed in the red material. When ignited in a DSC device the chips exhibit large but narrow exotherms occurring at approximately 430 °C, far below the normal ignition temperature for conventional thermite. Numerous iron-rich spheres are clearly observed in the residue following the ignition of these peculiar red/gray chips. The red portion of these chips is found to be an unreacted thermitic material and highly energetic.

The authors

  • Niels H. Harrit: Associate Professor Emeritus, Ph.D. Chemistry, University of Copenhagen, 1975, Thesis: mechanistic photochemistry; has published on some nano-stuff, but his main method is Spectrophotometry, and his main research interests focus around organic chemistry, photochemistry, fluorescence. Profile at AE911T
  • Jeffrey K. Farrer: PhD in Material Scince. Lab manager (read: technician) for electromicroscopy at BYU. Non-facult. Has about 4 legit scientific paper to his credit (3 at the Journal of Materials Science). Profile at AE911T
  • Steven E. Jones: Former Physics professor at BYU. The driving force behind this effort. Profile at AE911T
  • Kevin R. Ryan: B.S. Chem; Chemist, former Underwriters Laboratories manager (read: technician). Has never published at any science jurnal, except on 9/11 CTs. Profile at AE911T
  • Frank M. Legge: Diploma of Agriculture; Logical Systems Consulting, Perth, Western Australia (Chemistry). Has a US Patent (4,765,309 of 08/23/1988) on a tracking device for solar panels. A Frank M. Legge has 1 paper on fatty diet. No other scientific credentials can be found. Profile at AE911T
  • Daniel Farnsworth: (Grad?) student at Department of Physics and Astronomy, BYU. Did not sign AE911T petition.
  • Gregg Roberts: Business Analyst, Technical Writer/Editor, VBA Dev, Psych. B.A., UT Austin, 1990; Graduate Work in Social Work. Gregg Roberts at AE911T
  • James R. Gourley: Did not sign AE911T petition.
  • Bradley R. Larsen: MS Geology, University of Utah; mineralogist for oil-gas and gold exploration for S&J Scientific Co.; Profile at AE911T

Criticism

The following weaknesses are found in the paper
  1. No proper peer-review
  2. Uncertainty about the source and chain of custody of the samples
  3. No comparison with thermite
  4. Comparison with one, unkown paint only is inconclusive
  5. Presence of C in all samples precludes DSC tests in atmosphere
  6. Energy release of >3.9J/g is proof that materials other than thermite react at 430°C
  7. The ignition point of 430°C is not shown to be indicative of any known thermite preparation and is contriaditcted by all known thermite preparations, which typically ignite above 900°C
  8. The chip that was soaked in MEK has different spectrum from chips a-d
  9. It is not clear how elemental Al was identified in chip e
  10. Elemental Al is known to react with MEK, making it highly unlikely that elemental Al was found after soaking 55 hours in MEK
  11. Comparison with images, formulae and spectra of known Kalolin preparations for paint show striking similarities with red layer
  12. Comparison with images, formulae and spectra of known Micaceous Iron Oxide preparations show stiking similarities with grey layer

Peer-reviewed?

The authors, and their supporter and parroters, do not tire of pointing out that the paper had been subjected to a proper peer-review process when it was published at Bentham Open. But is this really so? Let's first look at how peer-review is usually done:
A scientific journal has an editor-in-chief, and possibly more editors
A paper submitted to a journal is first reviewed by the editor. The editor determines the subject matter, picks a few scientists whom she or he deems experts on the subject matter ("peers"), and sends them the submission for review
The peers send back a critique, with recommendations that can be of the following nature: i.) accept without reservations ii.) accept with minor corrections iii.) reject, and ask author to resubmit when certain problems are fixed, iv.) reject right away (paper has no chance)
The editor reads the peer-reviews, and then decides if and how to publish the paper

So the role of the editor is absolutely central to the peer-review process.

Bentham's "The Open Chemical Physics Journal" isn't exactly hustling and bustling and overburdening the editor-in-chief with hundreds of submissions to be processed. In fact, in all of 2009, the journal published only 4 papers (View journal articles), totalling 46 pages.

How was the paper handled by TOCPJ's editor in chief? Editor in chief was Professor Marie-Paule Pileni. When the Danish science magazine videnskab.dk contacted Mrs. Pileni to get further information about the recently published Harrit-paper, they were in for a surprise (Translation): Mrs. Pileni, the editor in chief, did not know that this paper had been published in her journal! She resigned immediately from her position at the Journal.

A paper that has been published without the knowledge of the editor in chief has not gone through a proper peer review process.

(Further notes: The journal has a whopping 95 people on the Editorial Advisory Board - that is more than 2 advisors per page published in the whole of 2009! TOCPJ has not a single paper published in 2010.

One has to wonder if the authors have tried to publish their paper at any journal that is not as obscure as TOCPJ. They would have saved money, because at TOCPJ, authors have to pay US$ 600 before their submissions are published!

And finally, a post about the reputation of Bentham OA journals in general at JREF)

Comparison with paint.

Harrit ed.al. conclude that the red-grey chips don't come from paint. They determined this by running the same tests on a chip sample, and on paint samples:
 Page 11(17): "The initial objective was to compare the behavior of the red layer with paint when soaked in a strong organic solvent known to soften and dissolve paint. ... In marked contrast, paint chips softened and partly dissolved when similarly soaked in MEK."
Page 16(22): "Several paint samples were also tested and in each case, the paint sample was immediately reduced to fragile ashes by the hot flame. This was not the case, however, with any of the red/gray chips from the World Trade Center dust."
Page 21(27): "We measured the resistivity of the red material ... and obtained a rough value of approximately 10 ohm-m. This is several orders of magnitude less than paint coatings we found tabulated which are typically over 1010 ohm-m [31]. ... On the other hand, paint samples in the same exposure to MEK solvent became limp and showed significant dissolution, as expected since MEK is a paint solvent."

It is striking that they mention paint samples several times, did work on the,, but fail to say which paint they tested! There must be hundreds of thousands of different paints and primers on the market, thousands used in the WTC and on all the objects in it, and several that had widespread use in the construction of the towers. Whatever paint they tested, one can't generalize fron these results:
- Some paints will get partly dissolved in MEK, but not all
- Some paints will immediately burn to fragile ashes in hot flame, but not all
- Some paints have high elecrical resistance, but not all

It bears noticing that both elemental aluminium and Fe<sub>2</sub>O<sub>3</sub> (rust) are very usual ingredients of many paints.

Even more interesting is the authors' description of the red-grey chips as fitting very nicely a description of paint films: On page 20(26): "Thus, the energetic nano-composite can be sprayed or even “painted” onto surfaces, effectively forming an energetic or even explosive paint. The red chips we found in the WTC dust conform to their description of “thin films” of “hybrid inorganic/organic energetic nanocomposite”. Indeed, the descriptive terms “energetic coating” and “nice adherent film” fit very well with our observations of the red-chips which survived the WTC destruction."

In typical "truther" parlance one could say: "The red-grey chips look just like paint"

I will further note in passing that thermitic materials, if "painted" on anything - that is: applied as a very thin layer - would bring so little chemical energy to a surface unit as to render it pathetically useless as an incendiary. The red layers are about 15 microns thick in some samples. It can be shown that one needs 3 volume units of thermite to melt 1 volume unit of iron, so a 15 micron layer of thermite could at most melt 5 microns of steel from a steel element. That is pathetically little! 15 microns thermite on a surface of 1m<sup>2</sup> is a volume of 15cm<sup>3</sup> and a mass of about 60g, containing about 240kJ of energy. Not even enough to heat 1 bottle (750ml) of water from room temperature to boiling point.

Ignition of thermitic material

From Thermite (Wikipedia):
"Ignition of a thermite reaction normally requires only a simple child's sparkler or easily obtainable magnesium ribbon, but may require persistent efforts, as ignition can be unreliable and unpredictable. ... Even when the thermite is hot enough to glow bright red, it will not ignite as it must be at or near white-hot to initiate the reaction. ... The reaction between potassium permanganate and glycerol or ethylene glycol is used as an alternative to the magnesium method. ... However, this method can also be unreliable and the delay between mixing and ignition can vary greatly due to factors such as particle size and ambient temperature."

Harrit ed.al. however claim to have ignited the red-grey chips, and started a thermitic reaction, at only 430°C: "As measured using DSC, the material ignites and reacts vigorously at a temperature of approximately 430 °C, with a rather narrow exotherm, matching fairly closely an independent observation on a known super-thermite sample. The low temperature of ignition and the presence of iron oxide grains less than 120 nm show that the material is not conventional thermite (which ignites at temperatures above 900 °C) but very likely a form of super-thermite."

Did they verify that superthermite has this property of igniting at only 430°C? No. On page 17(23) they state: "We would like to make detailed comparisons of the red chips with known super-thermite composites, along with comparisons of the products following ignition, but there are many forms of this high-tech thermite, and this comparison must wait for a future study.". They reference the following papers in conjunction with superthermite:
[20] http://www.p2pays.org/ref/34/33115.pdf
[21] http://www.mrs.org/s_mrs/sec_subscribe.asp?CID=2642&DID=115856&action=detail
[22] http://www.mrs.org/s_mrs/sec_subscribe.asp?CID=2642&DID=115976&action=detail
[30] http://awards.lanl.gov/PDFfiles/Super-Thermite_Electric_Matches_2003.pdf
The first 3 don't mention temperature of ignition. [30] explicitly states that super-thermite matches are particularly heat-resistant! See page 21(27):
"The Super-Thermite electric matches produce no toxic lead smoke and are safer to use because they resist friction, impact, heat, and static discharge through the composition, thereby minimizing accidental ignition."
We must conclude then that Harrit ed.al.'s assumption that a low ignition temperature may be indicative of superthermite is inproven at best. It isn't even specuation, as they give two separate reasons in the paper why we should believe thermite and superthermite only ignite at very high temps above 900°C. It is best characterized as wishful thinking. In the worst case, the assertion is outright fraudulent. The statement "the material ignites and reacts vigorously at a temperature of approximately 430 °C, with a rather narrow exotherm, matching fairly closely an independent observation on a known super-thermite sample" is wrong. They did not have a known super-thermite sample that ignited at 430°C. The statement, on page 15(21) "That thermitic reactions from the red/gray chips have indeed occurred in the DSC (rising temperature method of ignition) is confirmed by the combined observation of 1) highly energetic reactions occurring at approximately 430 °C" is wrong. As neither their own experiments nor the referenced literature indicate that any thermite reacts at 430°C, it is not true that the "highly energetic reactions occurring at approximately 430C" confirms that these reactions were thermitic. It remains unkown.

Energy release

Several times in the paper, the authors label reactions or materials as "highly energetic": pp 1(7), 15(21), 19(25), 21(27), 23(29). This label is misleading.
The authors admit that the thermite they are looking at (Fe2O3+Al) releases a theoretical maximum of 3.9kJ of energy per gram (p21(27)). They are themselves struck by the observation that their red/gray chips sometimes release more energy than that, which absolutely proves that whatever burned there could not just be thermite! This is quickly explained away by assuming that the samples also contain organic substances. These must have be even more "highly energetic" than thermite. How "highly energetic" are organic compounds? Here are some examples (all values are kJ/g):
3.9: Thermite (Fe2O3 + Al)
4.6: TNT
7: strongest high explosives
8: Household waste
17: Sugar
18: Wood
18: PVC
22: Potato chips
23. PET
26: Polyester (plastic)

32: black coal
38: Body fat
41: Polystrene (plastic)
43: Jet fuel
46: Polyethylene, Polypropylene (Plastics)
We find that pretty much all organic materials around us are a lot more "highly energetic" than thermite!

Coming back to the finding that one sample released more energy than thermite could possibly contain. This shows clearly that the samples are "contaminated". We must assume it highly likely that all samples, including those that released less than 3.9kJ/g heat, were contaminated with unknown organic material. Which raises the question: Could it not be the organic component of the samples that ignites at 430°C? Fact is: Many organic materials ignite at temperatures ranging between 230°C and 500°C. This includes all sorts of resins on which paints and primers are based.

The ignition point, and the energy released, point to small amount of organic materials. They are both nit typical for any known thermite.

On to another topic: The paper is clear that whatever they are analysing there is not ordinary thermite: p. 19(25): "All these data suggest that the thermitic material found in the WTC dust is a form of nanothermite, not ordinary (macro-) thermite." What properties does nanothemrite have, other than consisting of nano-sized particles? The paper quotes this:
"... when the ingredients are ultrafine-grain and are intimately mixed, the mixture reacts very rapidly, even explosively [20]. Thus, there is a highly energetic form of thermite known as an energetic nanocomposite or “super-thermite ..."
This wording makes it appear as if the ultrafine grains and intimate mixing somehow make the mixture (even more) "highly energetic". This is not so. The energy content does not change because of the physical structure of the thermite. All that changes is the reaction rate, or energy release rate.

Conclusions
The paper lists 10 characteristics or observations, before coming to a conclusion. I will address each of the 10 observations:
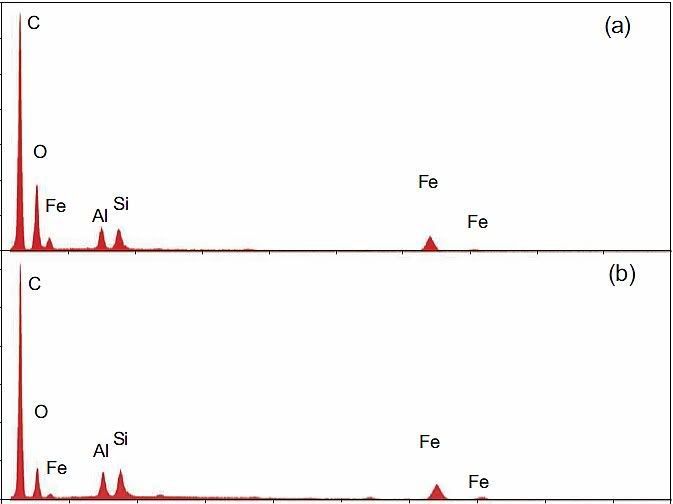
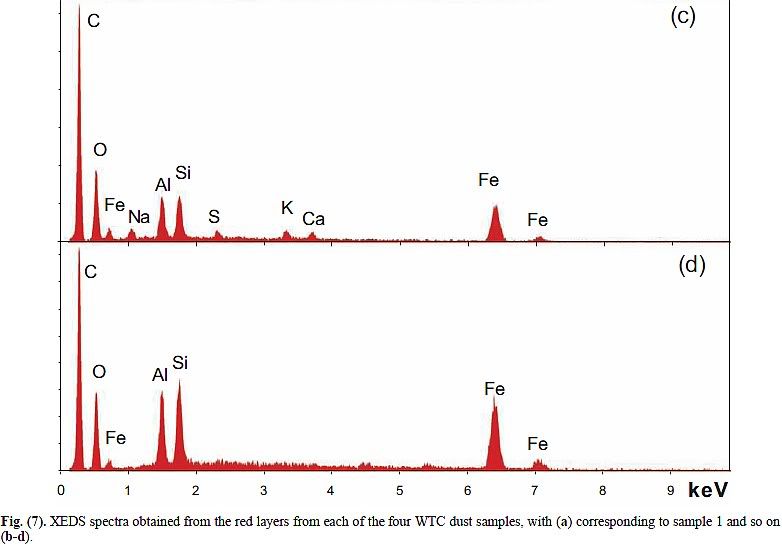
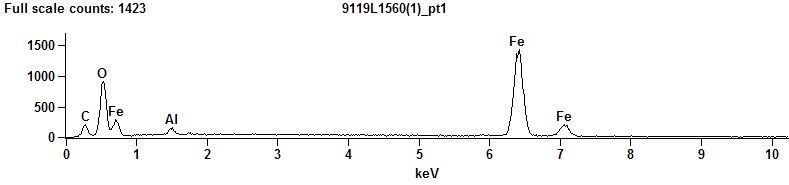
1. It is composed of aluminum, iron, oxygen, silicon and carbon. Lesser amounts of other potentially reactive elements are sometimes present, such as potassium, sulfur, lead, barium and copper.
 They did not measure hydrogene, as that element is too light for their method (p.22(28): "
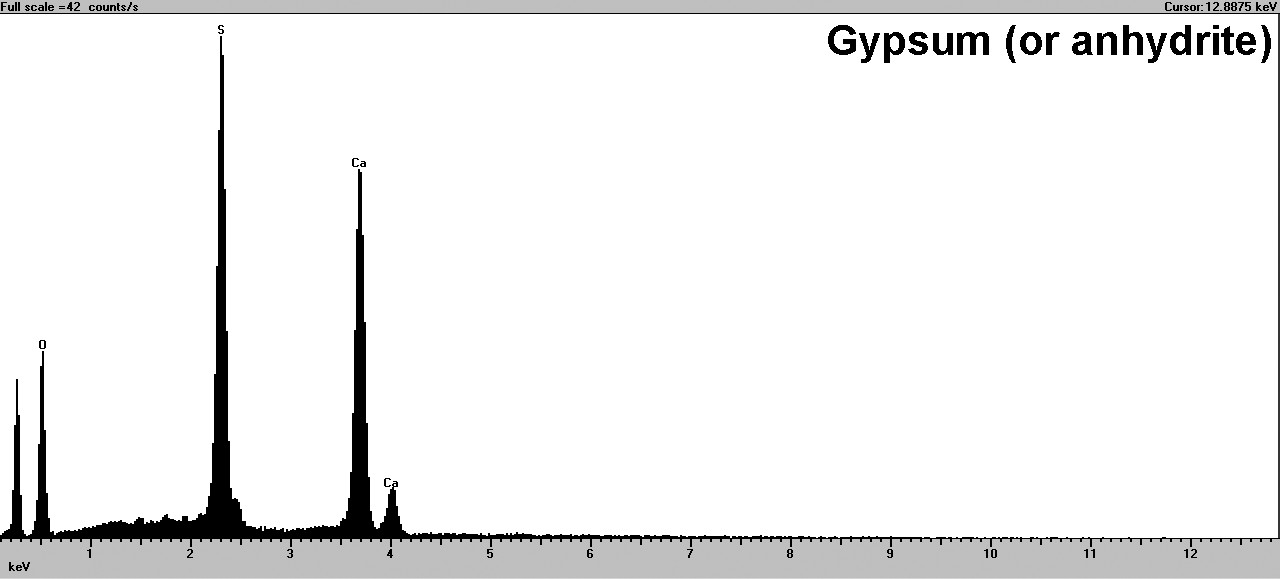
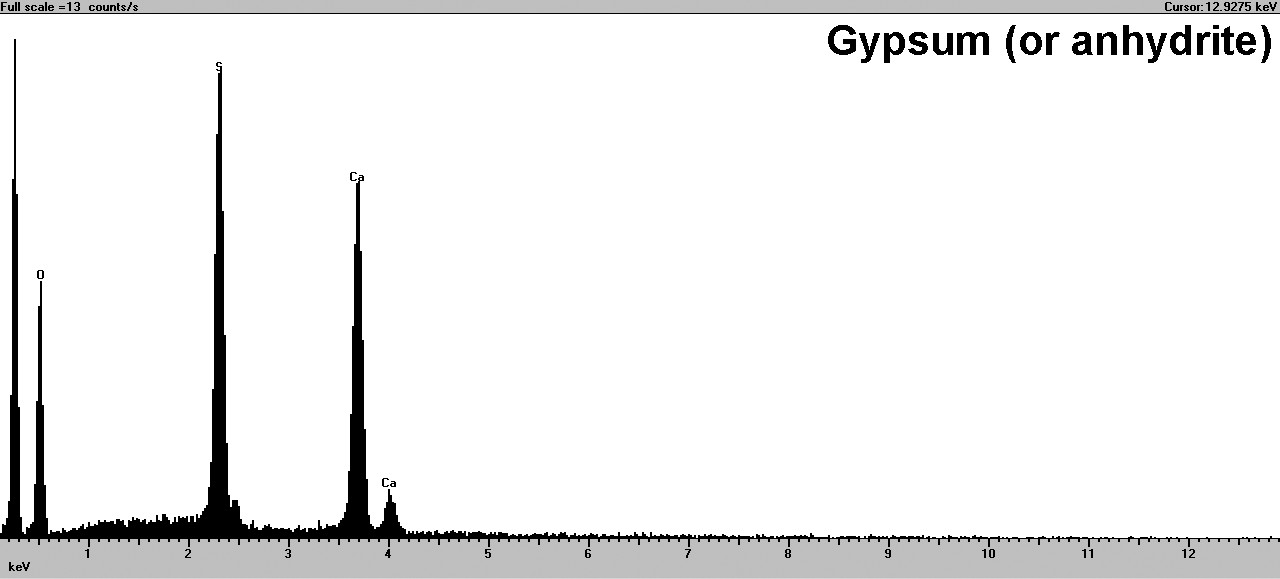
the middle-layer gray material contains carbon and oxygen and presumably also contains hydrogen, too light to be seen using this method". The elements listed first are precisely those that would be expected to be most abundand in the dust of a building collapse, as they are the constituents of the main materials: Steel Aluminium cladding, concrete and plastics. Sulfur, lead and copper are also abundand in office buildings. It is unclear why barium is mentioned in the conclusions - no data in the paper lists barium.
2. The primary elements (Al, Fe, O, Si, C) are typically all present in particles at the scale of tens to hundreds of nanometers, and detailed XEDS mapping shows intimate mixing.
 This is primarily due to the authors choosing their samples precisely because of this property. They specifically searched for nano-sized constituents, and could be sure to find some in any dust.

3. On treatment with methyl ethyl ketone solvent, some segregation of components occurred. Elemental aluminum became sufficiently concentrated to be clearly identified in the pre-ignition material.
It remains unclear what that segregation was supposed to achieve. But ok, we learn that aluminium was present. No surprise here.
4. Iron oxide appears in faceted grains roughly 100 nm across whereas the aluminum appears in thin platelike structures. The small size of the iron oxide particles qualifies the material to be characterized as nanothermite or super-thermite.
Actually, no. Conjecture. Nano-sized particles, incuding Fe2O3, are not at all unusual in paints.
5. Analysis shows that iron and oxygen are present in a ratio consistent with Fe2O3. The red material in all four WTC dust samples was similar in this way. Iron oxide was found in the pre-ignition material whereas elemental iron was not.
No one is surprised. Rust is plentiful in buildings, and a very ordinary constituent of anti-corrosion primers.
6. From the presence of elemental aluminum and iron oxide in the red material, we conclude that it contains the ingredients of thermite.
This is true. Fe2O3 and Al are indeed the main ingredients of thermite.
7. As measured using DSC, the material ignites and reacts vigorously at a temperature of approximately 430 °C, with a rather narrow exotherm, matching fairly closely an independent observation on a known super-thermite sample. The low temperature of ignition and the presence of iron oxide grains less than 120 nm show that the material is not conventional thermite (which ignites at temperatures above 900 °C) but very likely a form of super-thermite.
Not at all. There is no reference in the paper to that  "independent observation on a known super-thermite sample". The paper itself references a paper that characterizes superthermite specifically as "heat resistant"!