Abstract
Harrit e.al. [1] and Millette [2] both examined the gray layers of red-gray chips found in the WTC dust using XEDS. This article will show that all nine gray layers are probably oxidized steel, with no significant differences in the level of oxidation between the two publications. However, while Harrit's four samples may well be the same steel alloy, Millette's seem to be different steel alloys. Perhaps one of Millette's specimens is of identical or similar steel as Harrit's.
Introduction
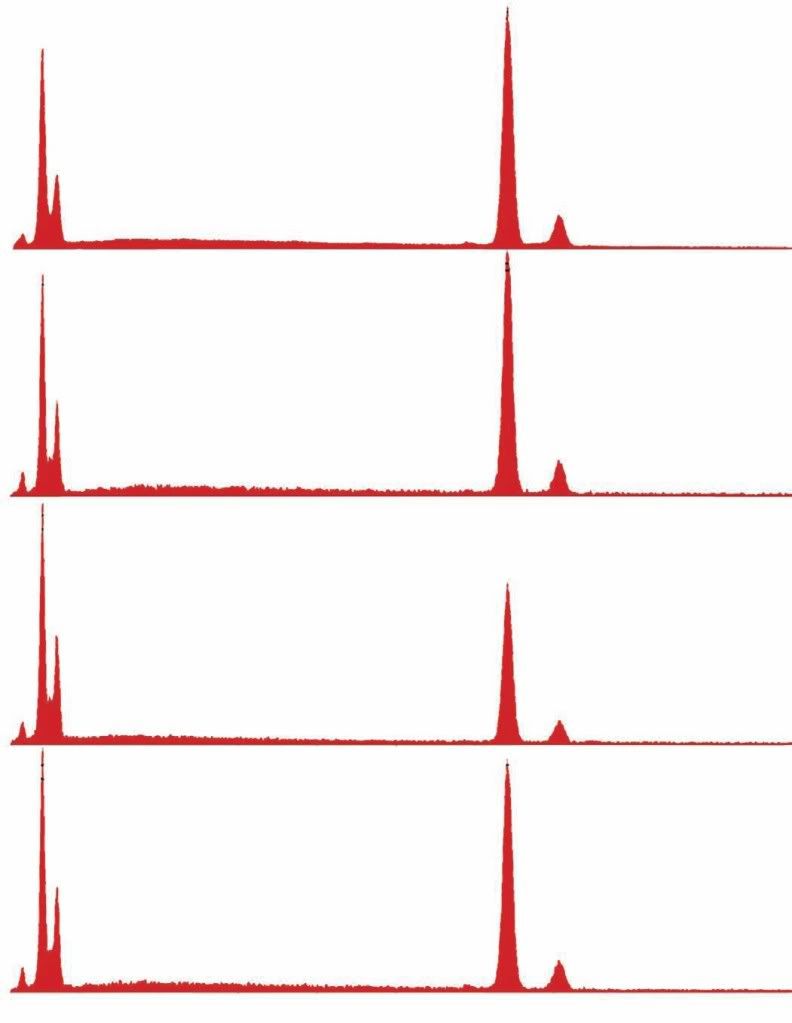
I measured the XEDS graphs of gray layer material thus far published by Harrit e.al. and Millete. Here are links to the bitmaps:
Harrit e.al.: Chips (a) – (d)
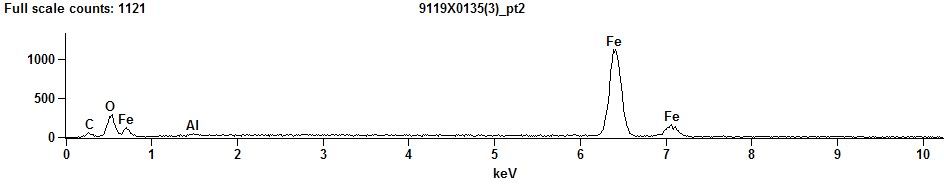
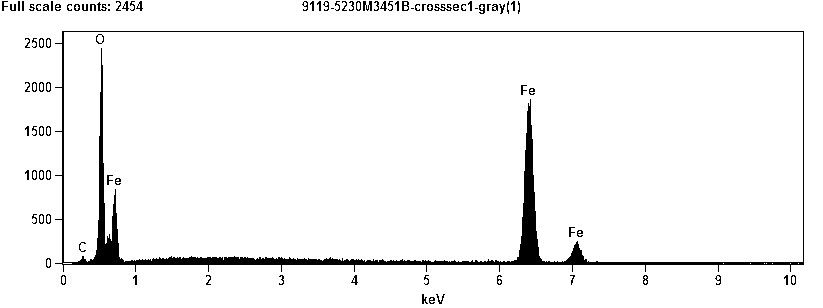
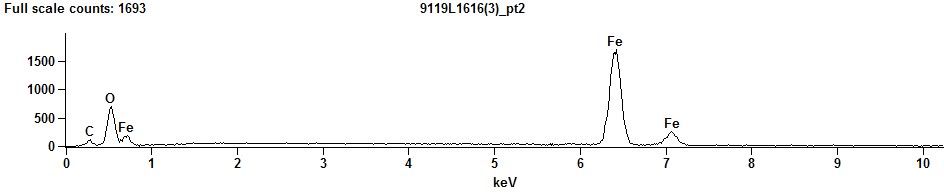
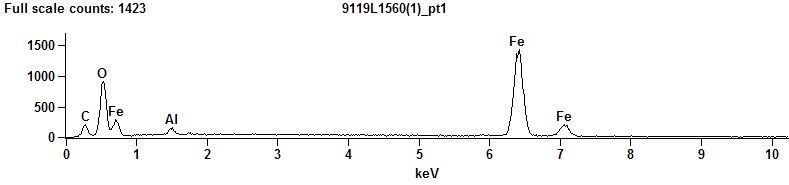
Millette: 9119X0135(3)_pt2, 9119-5230M3451B-crosssec2-gray(1), 9119-5230M3451B-crosssec1-gray(1), 9119-4808L1616(3)_pt2, 9119-4795L1560(1)_pt1
The following Table lists the peak height in pixels:
|
Element |
C |
O |
Fe |
Al |
Mn |
Fe |
Fe |
|
Level |
|
K |
L-a |
K-a |
K-a |
K-a |
K-b |
|
Edge Energy (keV) |
|
0.54 |
0.84 |
1.49 |
5.9 |
6.4 |
7.08 |
|
Millette's gray layers: |
|
|
|
|
|
|
|
|
9119X0135(3)_pt2 |
5 |
23 |
10 |
4 |
0 |
88 |
13 |
|
9119-5230M3451B-crosssec2-gray(1) |
7 |
201 |
64 |
0 |
0 |
215 |
29 |
|
9119-5230M3451B-crosssec1-gray(1) |
7 |
215 |
74 |
0 |
0 |
164 |
22 |
|
9119-4808L1616(3)_pt2 |
7 |
41 |
11 |
0 |
0 |
97 |
15 |
|
9119-4795L1560(1)_pt1 |
13 |
56 |
18 |
10 |
0 |
88 |
13 |
|
Harrit's gray layers: |
|
|
|
|
|
|
|
|
Chip (a) |
20 |
266 |
98 |
0 |
10 |
322 |
45 |
|
Chip (b) |
32 |
335 |
127 |
0 |
9 |
326 |
48 |
|
Chip (c) |
30 |
320 |
144 |
0 |
0 |
215 |
32 |
|
Chip (d) |
33 |
324 |
140 |
0 |
11 |
309 |
43 |
I then computed the relative peak heights, using a formula (Individual peak height) / Sum(all peaks in the same line). So for example, in Sample Chip (a), C has a pixel height of 20px, and the sum off all pixel heights is (20+266+98+0+10+322+45), and thus relative peak height of C would be 20 / (20+266+98+0+10+322+45) = 2.63%. With this crude method, I normalize the different absolute dimensions of the graphs. Here's the result:
|
Element |
C |
O |
Fe |
Al |
Mn |
Fe |
Fe |
|
Level |
|
K |
L-a |
K-a |
K-a |
K-a |
K-b |
|
Edge Energy (keV) |
|
0.54 |
0.84 |
1.49 |
5.9 |
6.4 |
7.08 |
|
Millette's gray layers: (This line: Arithmetic mean) |
3.39% |
30.38% |
10.05% |
1.57% |
0.00% |
47.68% |
6.92% |
|
9119X0135(3)_pt2 |
3.50% |
16.08% |
6.99% |
2.80% |
0.00% |
61.54% |
9.09% |
|
9119-5230M3451B-crosssec2-gray(1) |
1.36% |
38.95% |
12.40% |
0.00% |
0.00% |
41.67% |
5.62% |
|
9119-5230M3451B-crosssec1-gray(1) |
1.45% |
44.61% |
15.35% |
0.00% |
0.00% |
34.02% |
4.56% |
|
9119-4808L1616(3)_pt2 |
4.09% |
23.98% |
6.43% |
0.00% |
0.00% |
56.73% |
8.77% |
|
9119-4795L1560(1)_pt1 |
6.57% |
28.28% |
9.09% |
5.05% |
0.00% |
44.44% |
6.57% |
|
Harrit's gray layers: (This line: Arithmetic mean) |
3.54% |
38.50% |
15.77% |
0.00% |
0.90% |
36.11% |
5.18% |
|
Chip (a) |
2.63% |
34.95% |
12.88% |
0.00% |
1.31% |
42.31% |
5.91% |
|
Chip (b) |
3.65% |
38.20% |
14.48% |
0.00% |
1.03% |
37.17% |
5.47% |
|
Chip (c) |
4.05% |
43.18% |
19.43% |
0.00% |
0.00% |
29.01% |
4.32% |
|
Chip (d) |
3.84% |
37.67% |
16.28% |
0.00% |
1.28% |
35.93% |
5.00% |
Discussion
I notice that Millette's graphs tend to have relatively larger peaks on the high side of the energy spectrum than Harrit's: On average, the ratio between the K-alpha and L-alpha level of Fe in Millette's graphs is 47.68% / 10.05% = 4.74. In Harrit's samples, that ratio is 36.11% / 15.77% = 2.29 – less than half. Of course, both K-alpha and L-alpha represent the same amount of Fe per sample – the differences in relative peak height thus do not represent differences in relative element abundance. So in order to compare the Fe:O ratio, it would be wrong to compare O with the far-away Fe-K-alpha level. I think it is a better idea to compare O with the nearby L-alpha level of iron. These ratios are:
|
Sample |
Ratio Fe(L-a) : O(K-a) |
|
Millette's gray layers: |
0.337 |
|
9119X0135(3)_pt2 |
0.435 |
|
9119-5230M3451B-crosssec2-gray(1) |
0.318 |
|
9119-5230M3451B-crosssec1-gray(1) |
0.344 |
|
9119-4808L1616(3)_pt2 |
0.268 |
|
9119-4795L1560(1)_pt1 |
0.321 |
|
Harrit's gray layers: |
0.407 |
|
Chip (a) |
0.368 |
|
Chip (b) |
0.379 |
|
Chip (c) |
0.450 |
|
Chip (d) |
0.432 |
Here is a plot of the individual samples in both datasets, ordered from highest to lowest Fe:O ration within each set:

While the Fe:O ratio appears slightly lower in Millette's samples, the difference isn't major (on average, Harrit e.al. and Millette differ from each other by ~20%). In any case, Millette's gray layers would appear slightly more oxidized (higher Fe:O-ratio means lower O:Fe-ratio), assuming the relative heights of neighboring peaks can be compared across the studies. I conclude that the data provided by both Harrit e.al and Millette indicate the presence of iron that is oxidized to a comparable degree.
All samples also show some carbon. In Harrit's samples, the ratios C : Fe(L-alpha) are all within a narrow band from 0.204 to 0.252 (mean: 0.225), while Millette's scatter from 0.095 to 0.722 (mean: 0.413). I caution the reader that XEDS signals for C are very sensitive to many influences, and variation in the data doesn't necessarily reflect an equal degree of variation in abundance.
On the other hand, 2 of Millette's 5 samples show some Al, and none Mn, while 3 of Harrit's 4 samples show some Mn, but no Al.
Conclusions
It would appear that all 9 samples are consistent with oxidized carbon steel; but while Harrit may well have 4 samples from the same steel, it appears that Millette's specimens may be different steel alloys. I find it possible that the 9119-5230M3451B specimen may be the same, or a similar, steel that Harrit e.al. looked at, while the 9119X0135(3), 9119-4808L1616(3) and 9119-4795L1560(1) specimens are different steels on account of their Al-content and probably too high carbon content.
This finding
lends confidence to the belief that both Harrit an Millette looked at red-gray chips where the gray layer is oxidized structural steel and red the layer is mineral pigments in organic matrix
reinforces the suspicion that there are several different kinds of red-gray chips in WTC dust
highlights the need to carefully identify and distinguish these different kinds of red-gray chips before any particular conclusions or further study are contemplated.
References
[1] Niels H. Harrit, Jeffrey Farrer, Steven E. Jones, Kevin R. Ryan, Frank M. Legge, Daniel Farnsworth, Gregg Roberts, James R. Gourley and Bradley R. Larsen: Active Thermitic Material Discovered in Dust from the 9/11 World Trade Center Catastrophe. The Open Chemical Physics Journal, 2009, 2, 7-31. Figure 6.
[2] James R. Millette: Report of Results: MVA9119. Progress Report on the Analysis of Red/Gray Chips in WTC dust. Prepared for Classical Guide, Denver, 29 February 2012. Appendix D: SEM Analysis of Cross-Sections (20 kV)
No comments:
Post a Comment